
Irrigation Optimization
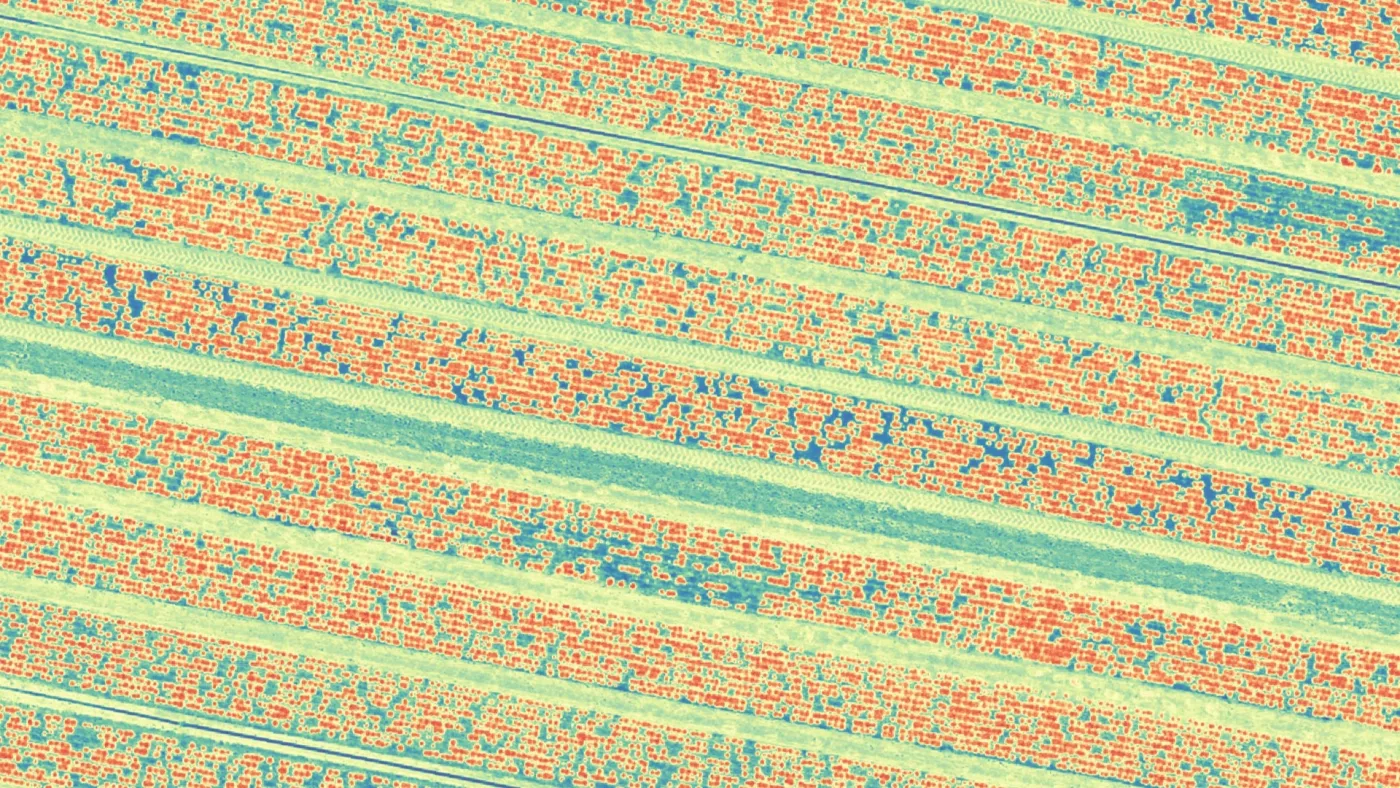
Thermal and index maps expose where water pools and where it never reaches, so you rebalance zones before stress shows up in yield.
01 Capability
We fly the field, then hand back the decision. Autonomous multispectral capture, photogrammetric processing and per-field prescriptions, from raw canopy to what to do next.
The workflow
Aerial data is only useful when it changes what happens on the ground. Every Altax agriculture flight runs the same disciplined pipeline of capture, process and decide, so the deliverable is a prescription, not a folder of pictures.
An autonomous multispectral mission flies the block at a fixed altitude and overlap, staying repeatable, hands-off and identical every pass so the data compares cleanly across the season.
Frames are stitched into a centimetre-grade orthomosaic through photogrammetry, then run through vegetation-index and detection analytics to surface what matters.
Results collapse into per-field prescriptions: zones, counts and priorities you can push straight to the sprayer, the scout or the irrigation controller.
What we map
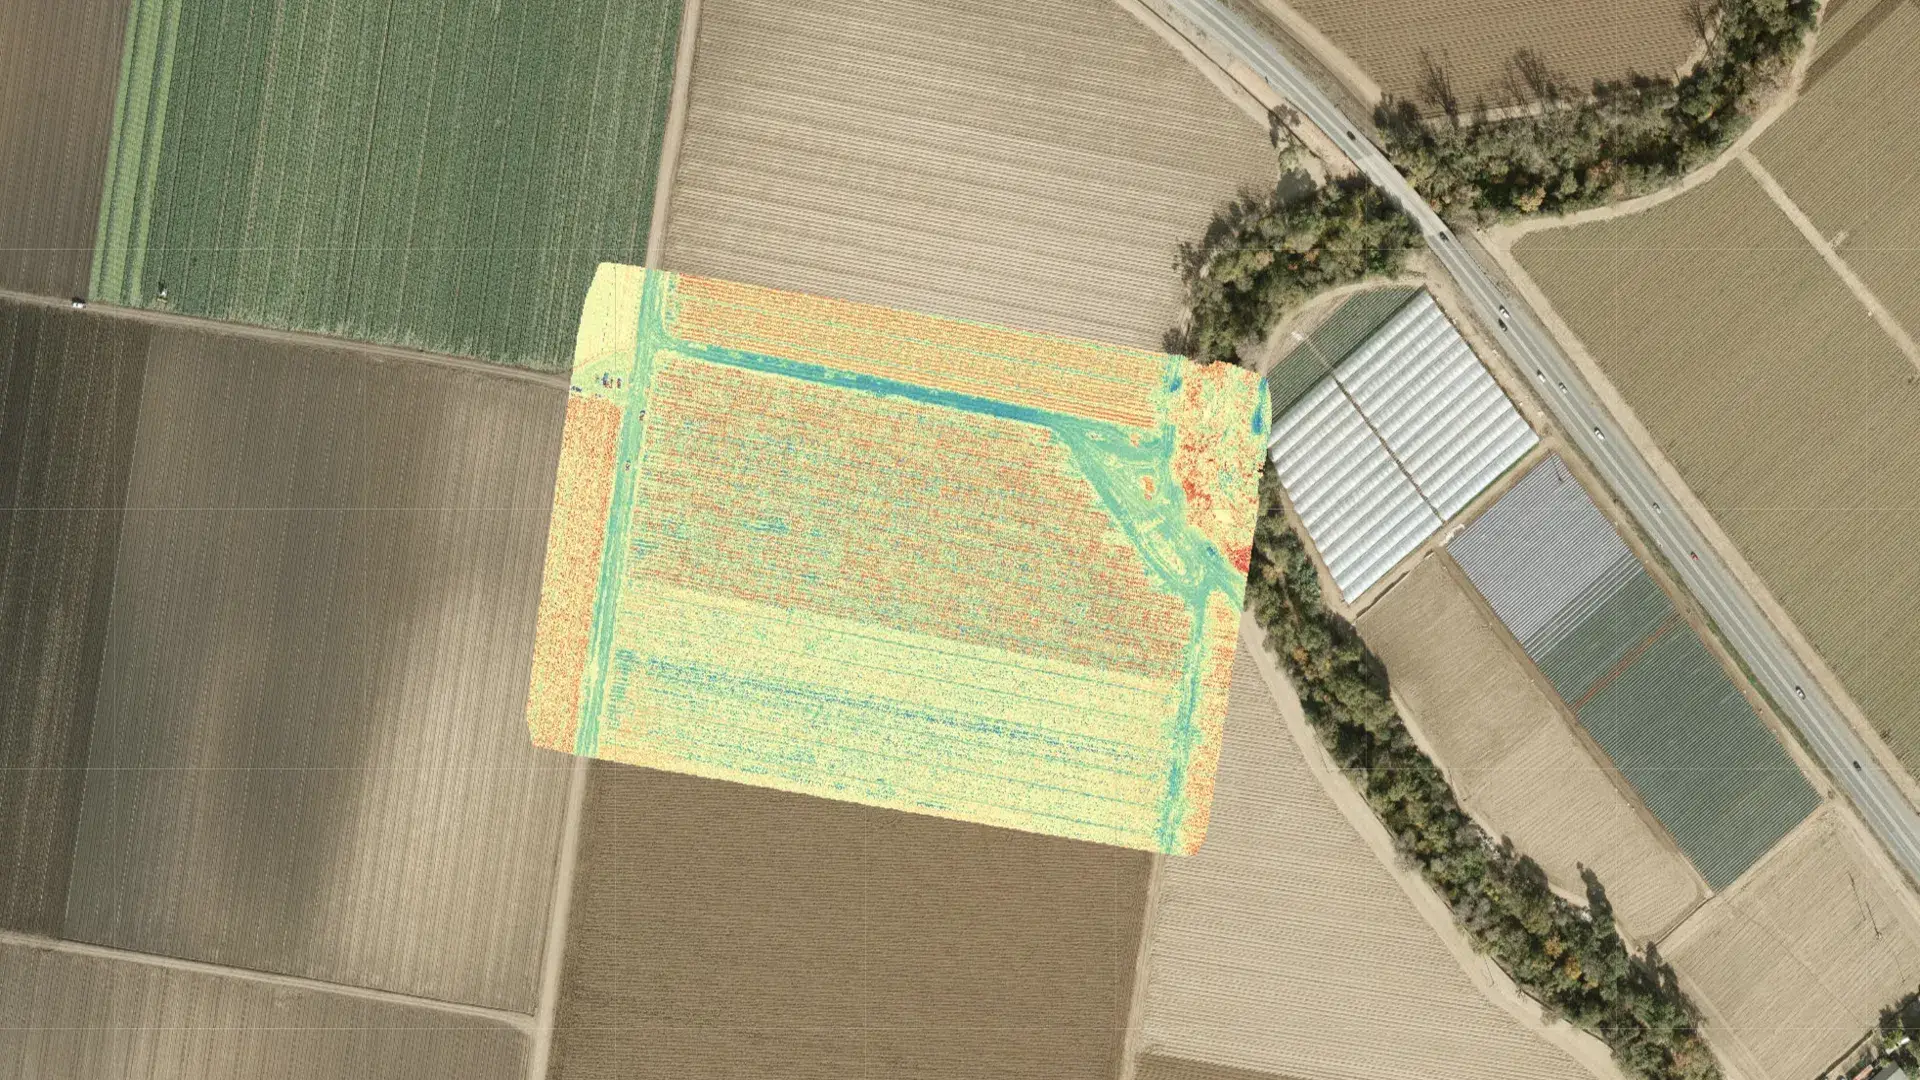
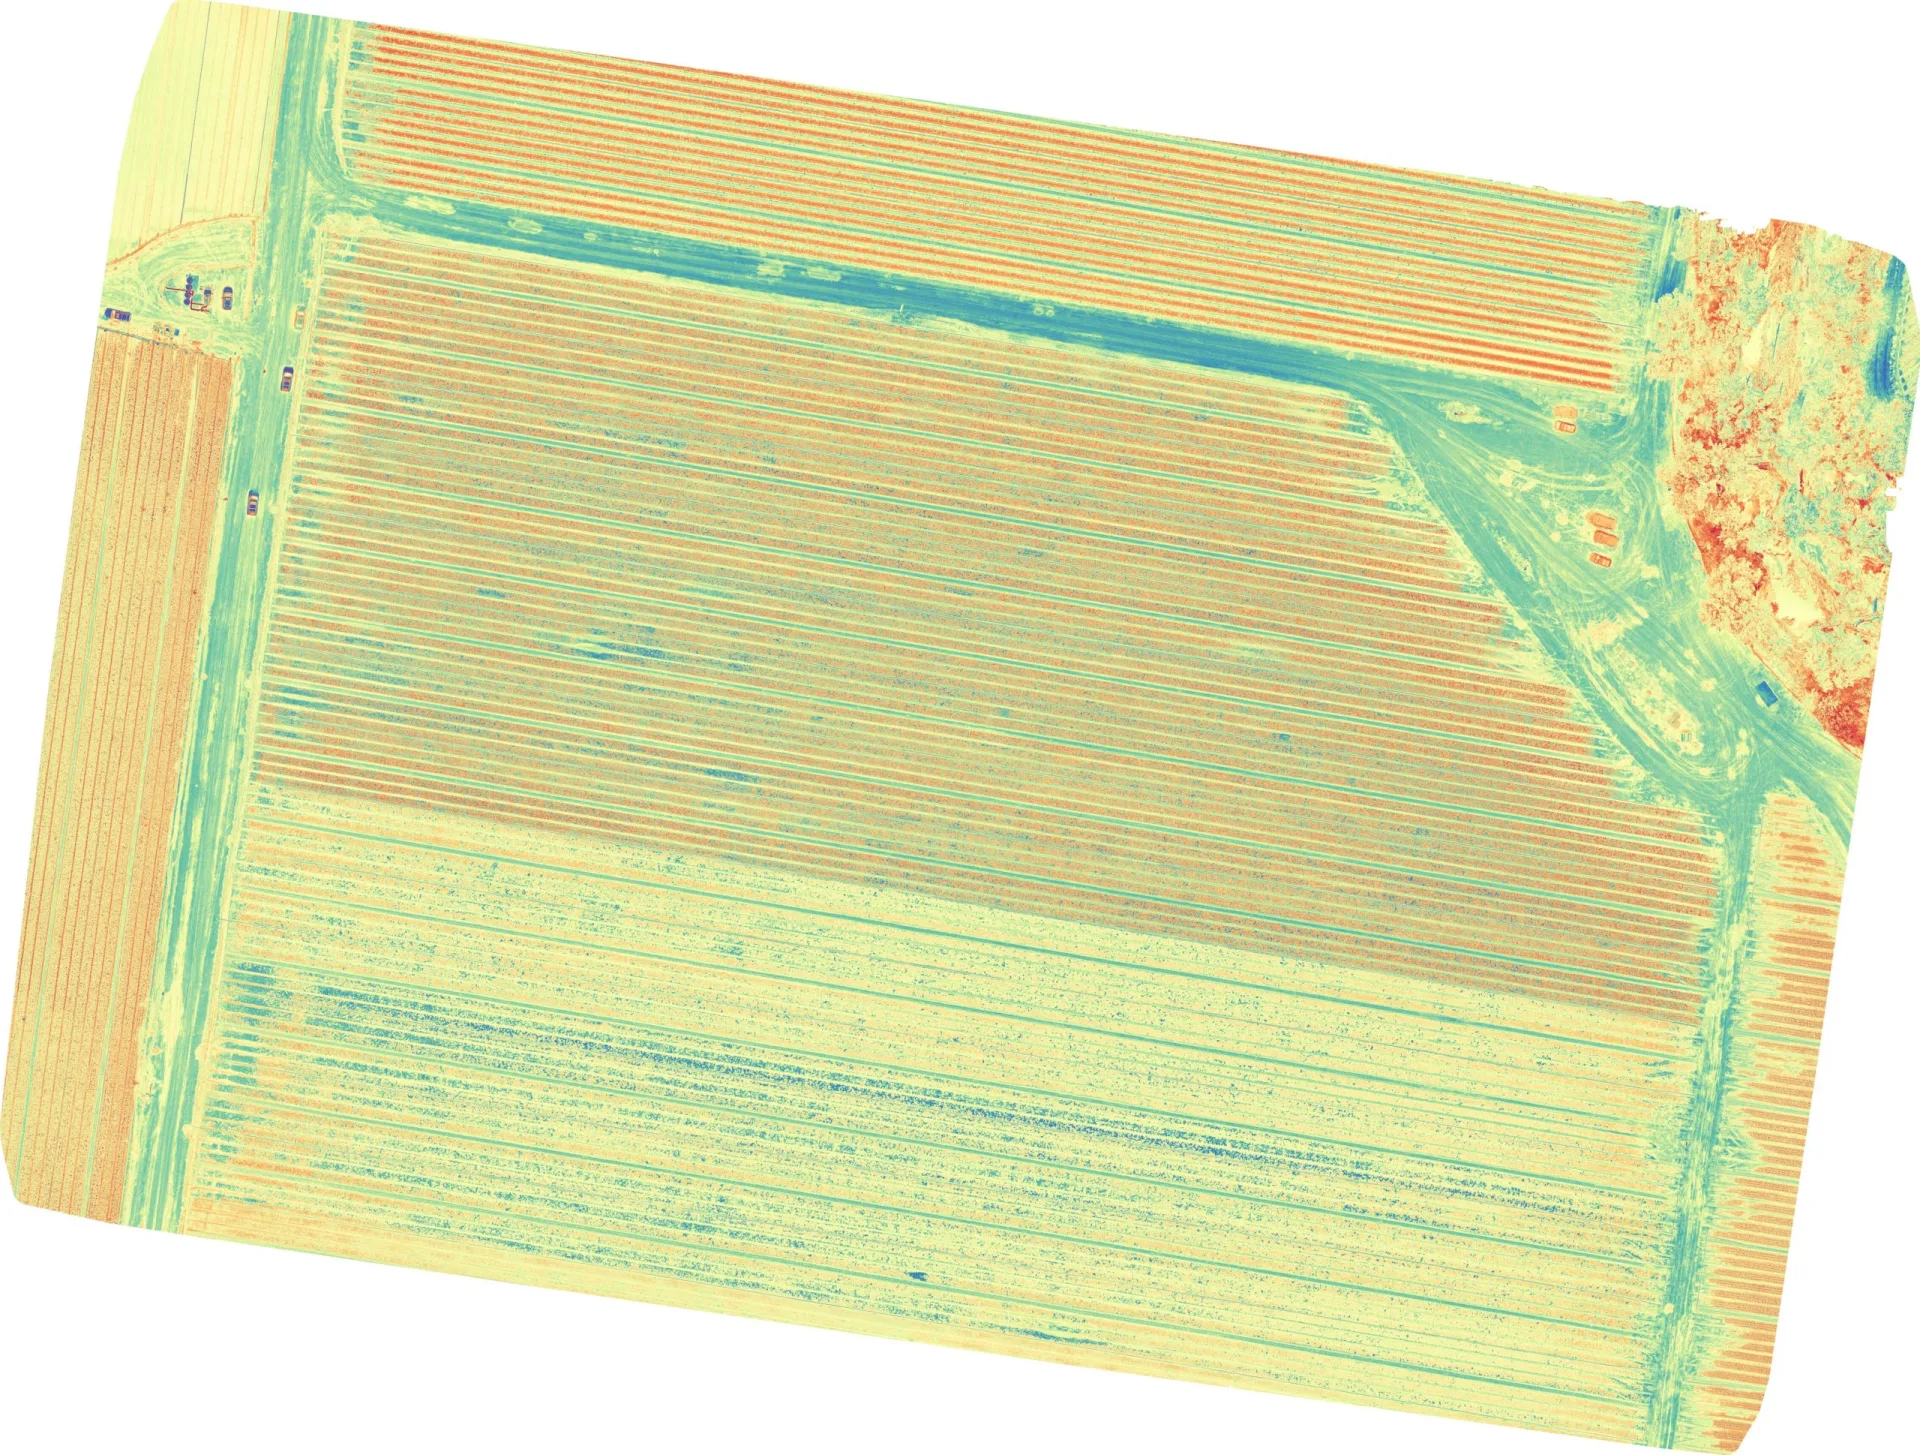
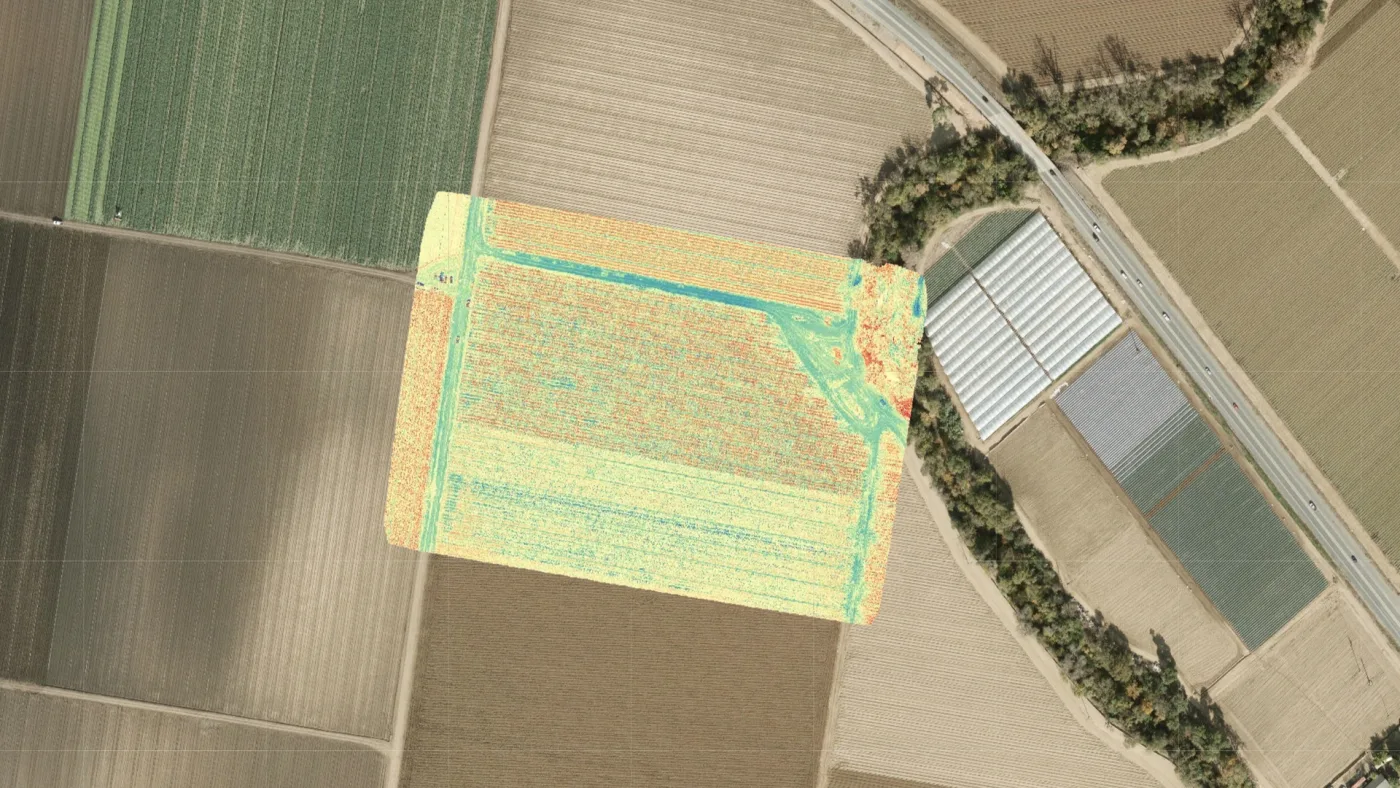
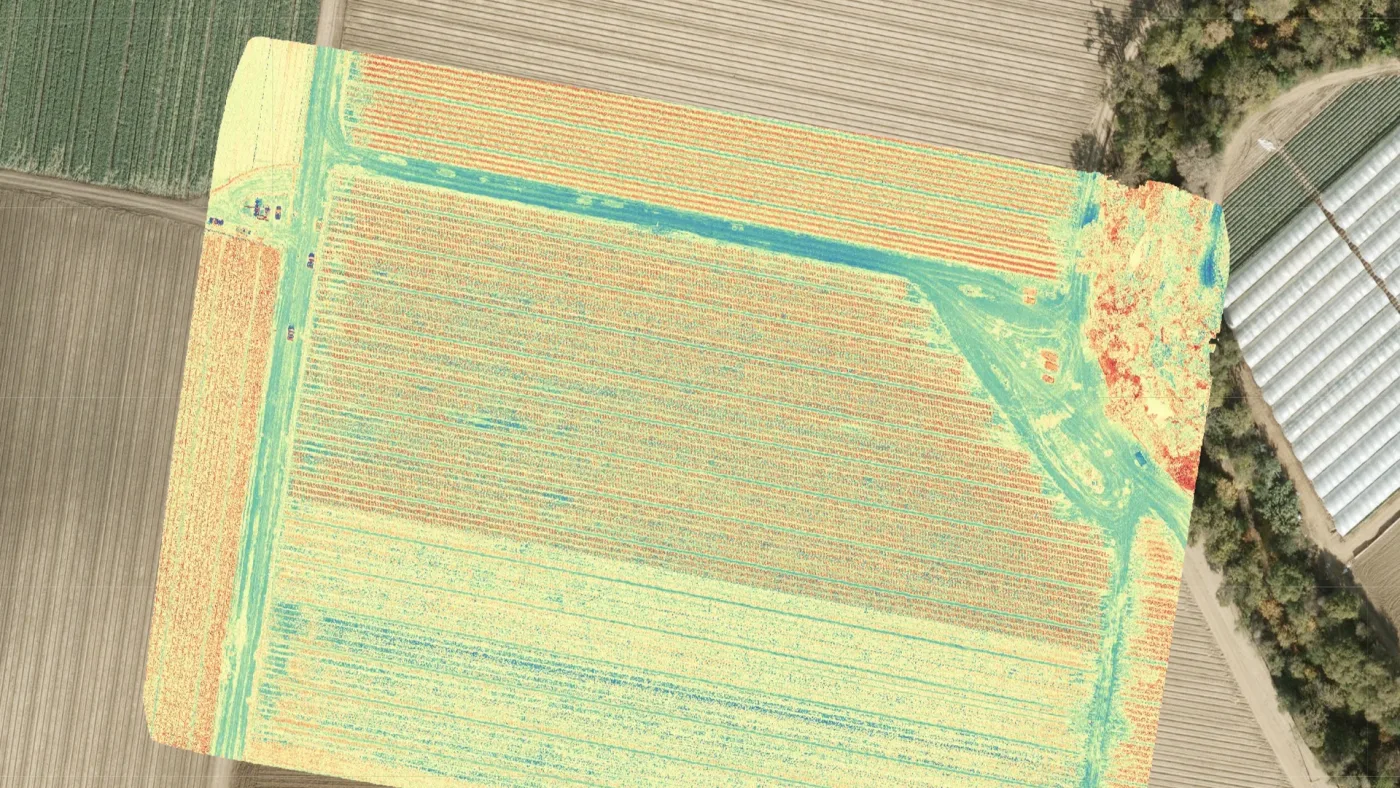
Thermal and index maps expose where water pools and where it never reaches, so you rebalance zones before stress shows up in yield.
NDVI and red-edge signatures flag nitrogen deficiency weeks ahead of the eye, turning blanket application into variable-rate prescriptions.
Early anomaly clusters in the canopy are isolated and geotagged, letting scouts walk straight to the outbreak instead of the whole block.
Per-plant vigour, leaf area and cover fraction, reconstructed from multispectral orthomosaics at centimetre resolution.
One index for the whole field: where the stand is even, where it thins, and how that trend moves flight to flight across the season.
Automated aerial counts and location of herds across open range, without the mustering, the fuel or the disturbance to the animals.
Multispectral · NDVI
A healthy plant reflects near-infrared light long before its colour shifts to green. Six calibrated spectral bands let us read chlorophyll activity directly, mapping vigour, stress and canopy density plant by plant across the whole field.
Automated counting
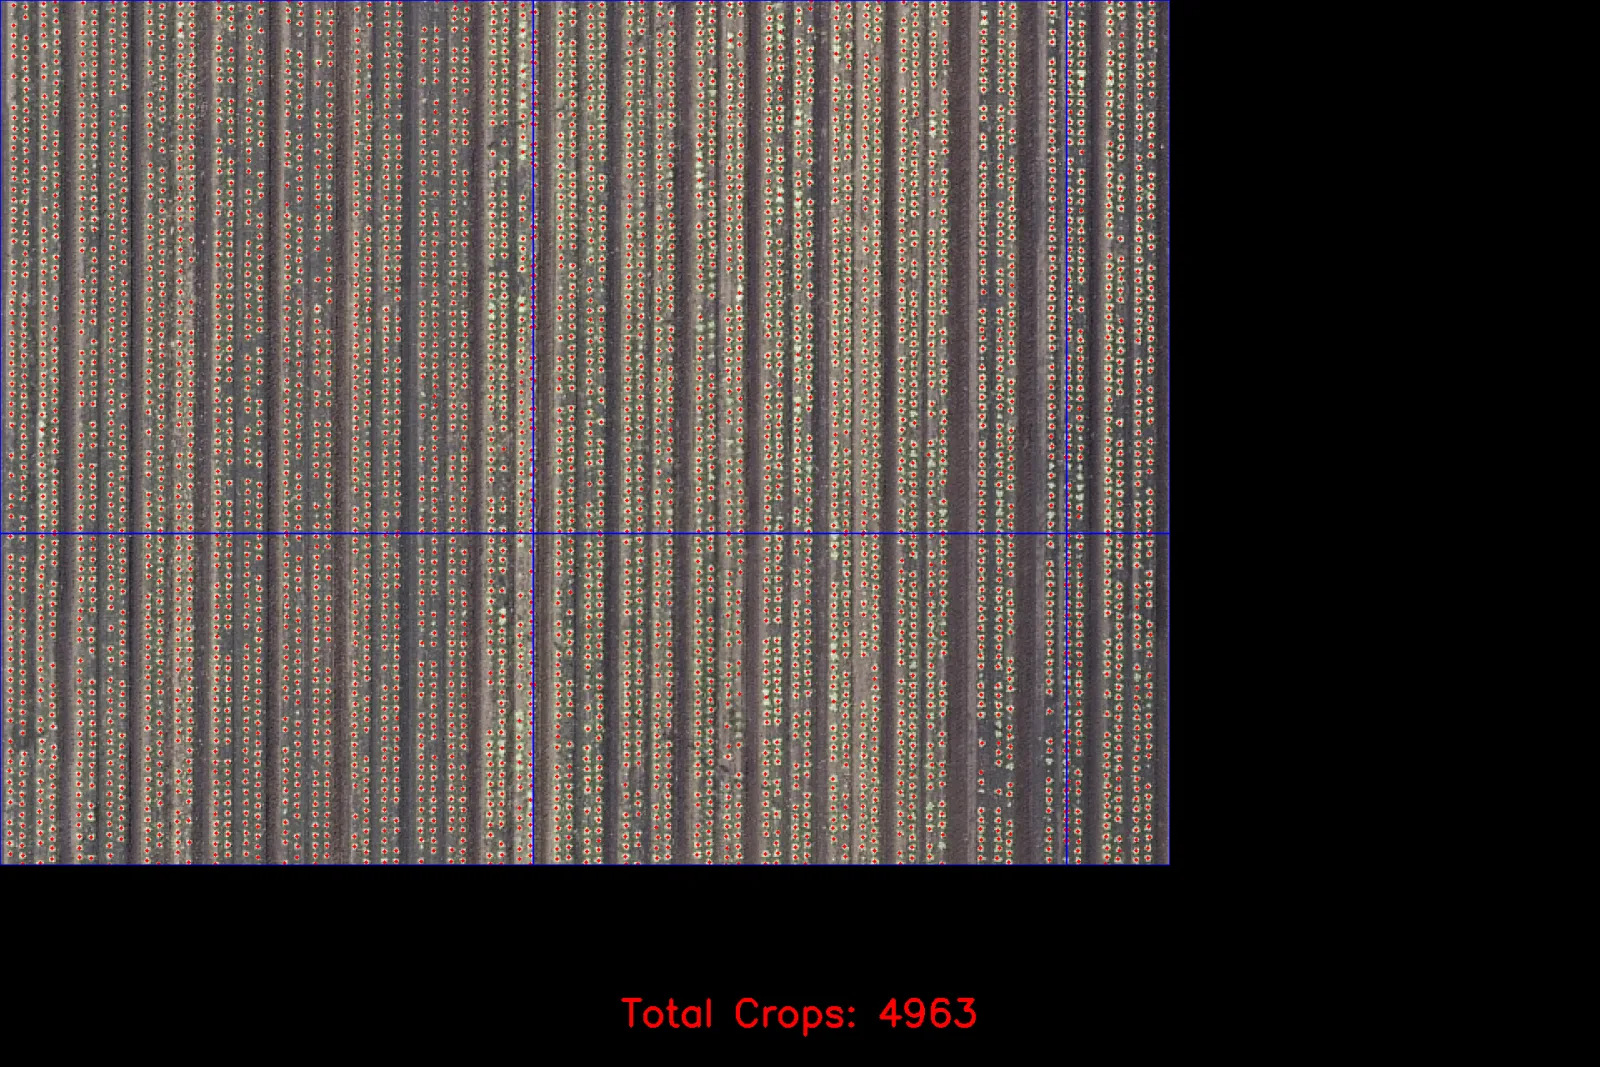
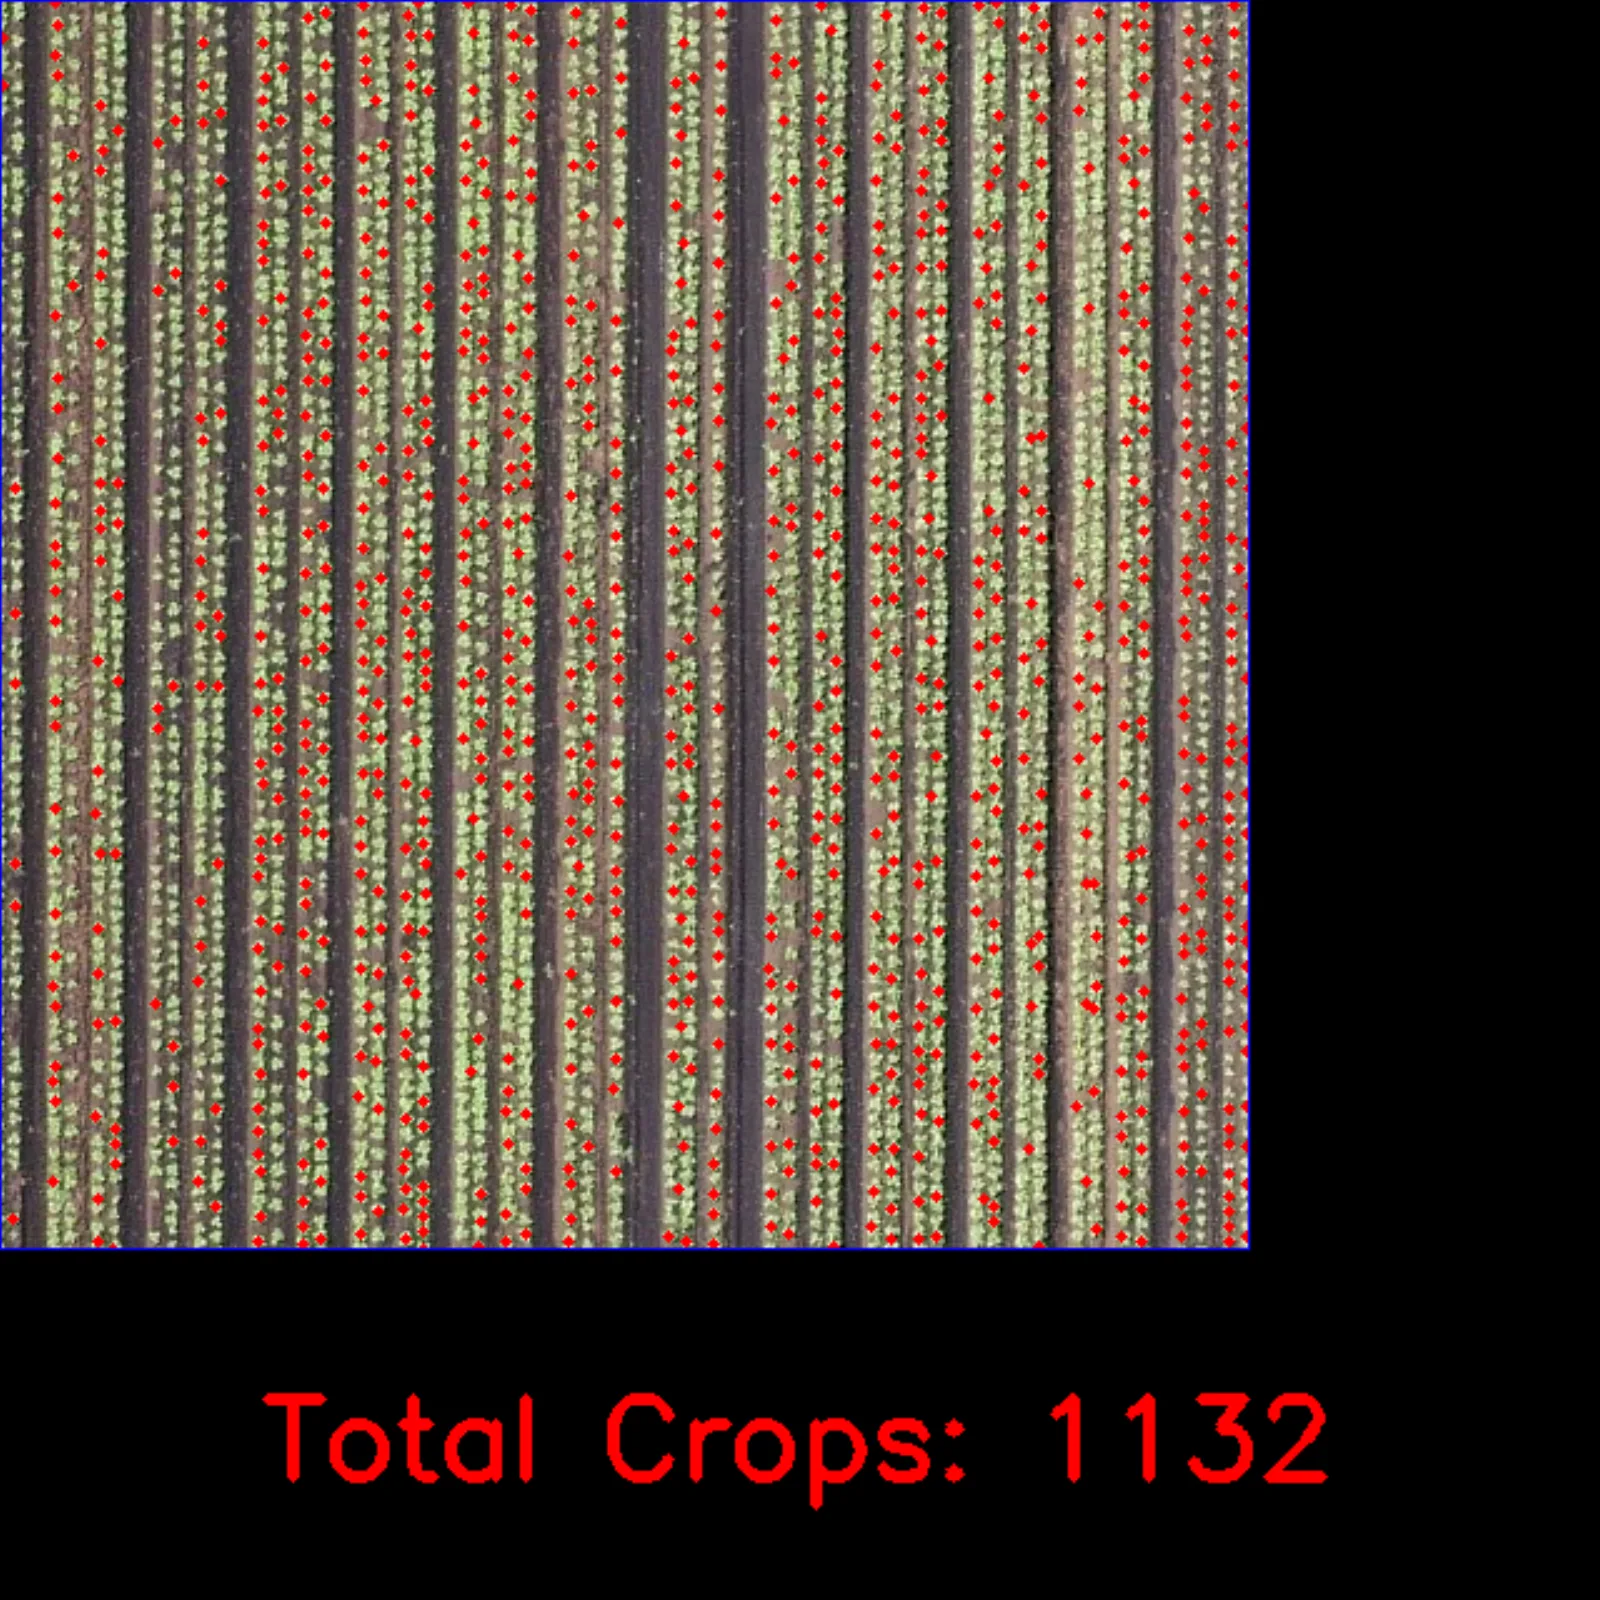
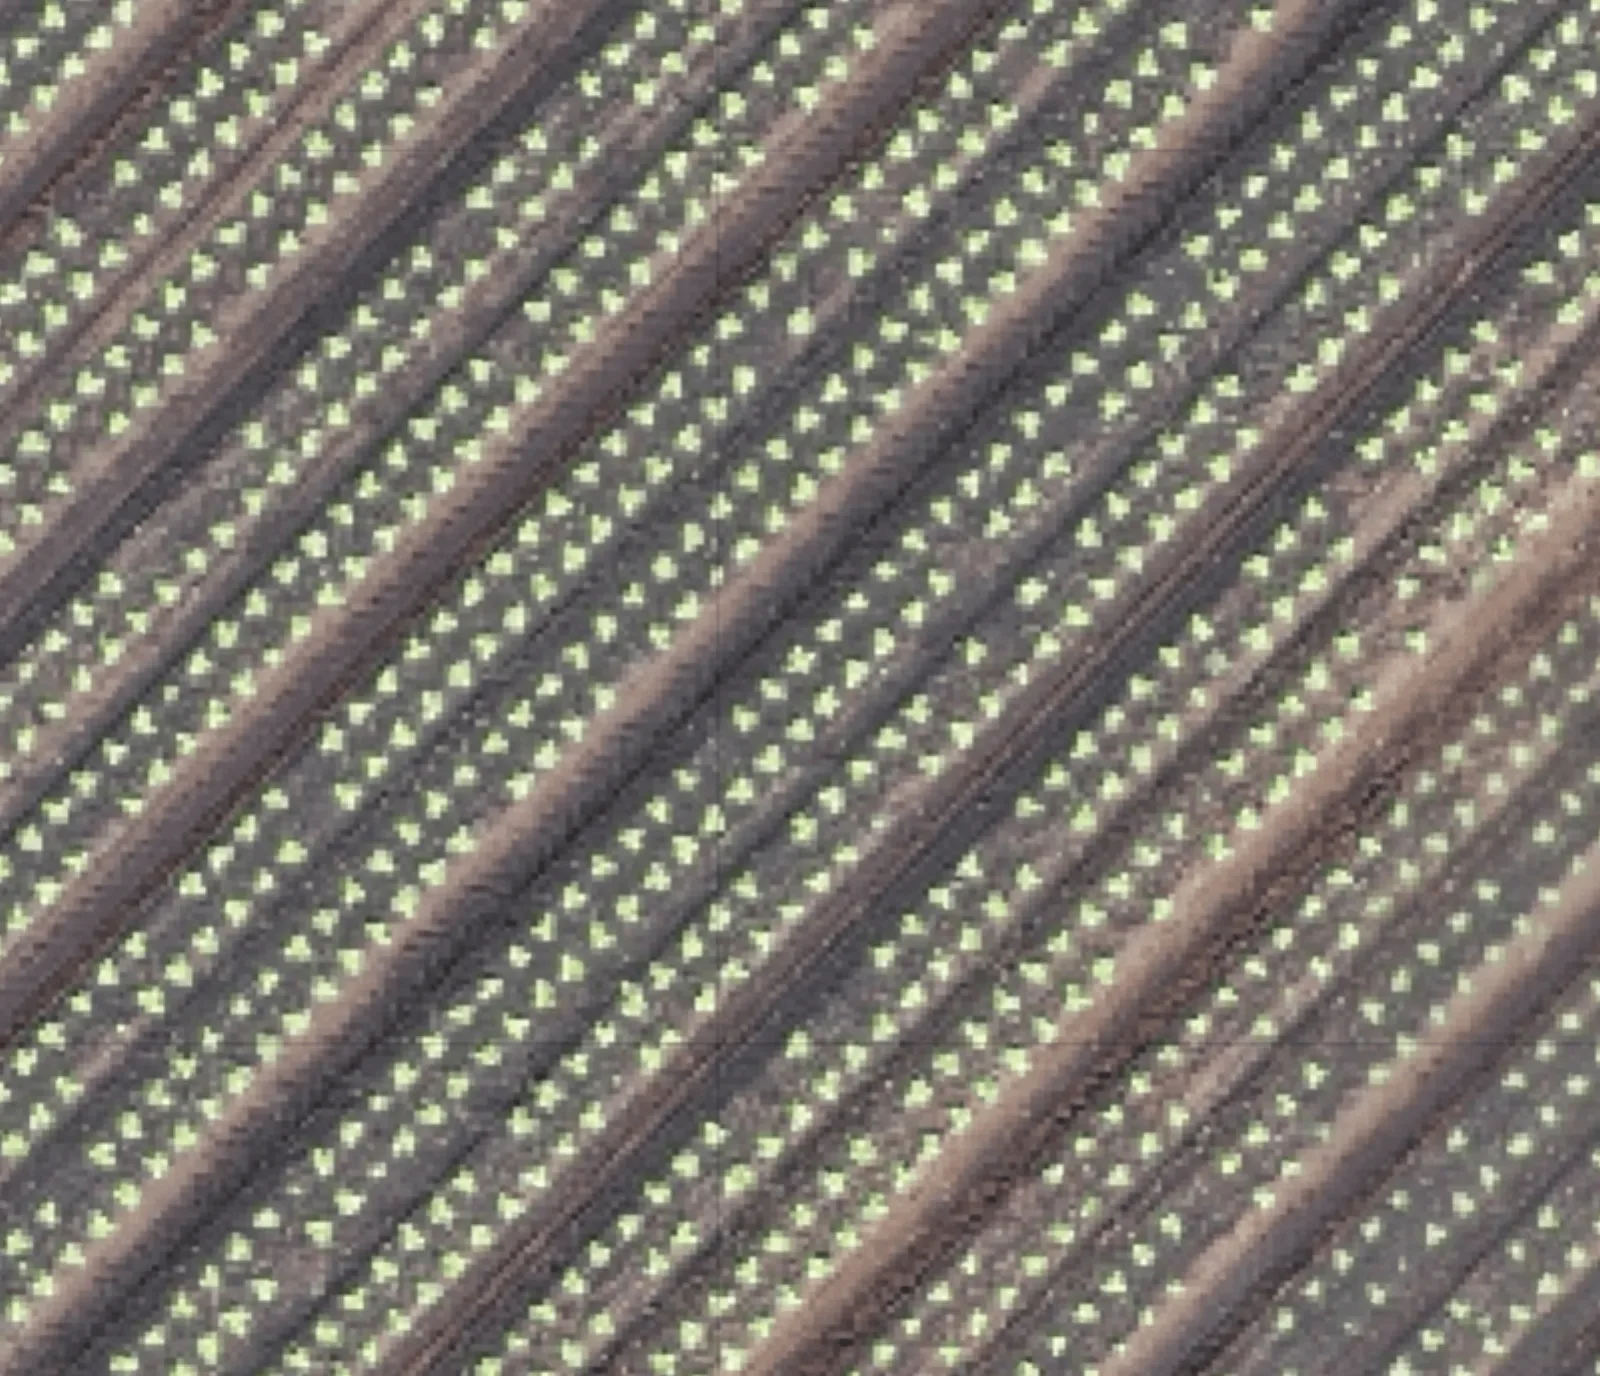
Stand counts done by hand are slow, sampled and out of date by the time they're tallied. We count every plant from a single automated pass (gaps, doubles and true stand included) and return it as an inventory, not an estimate.
Field study
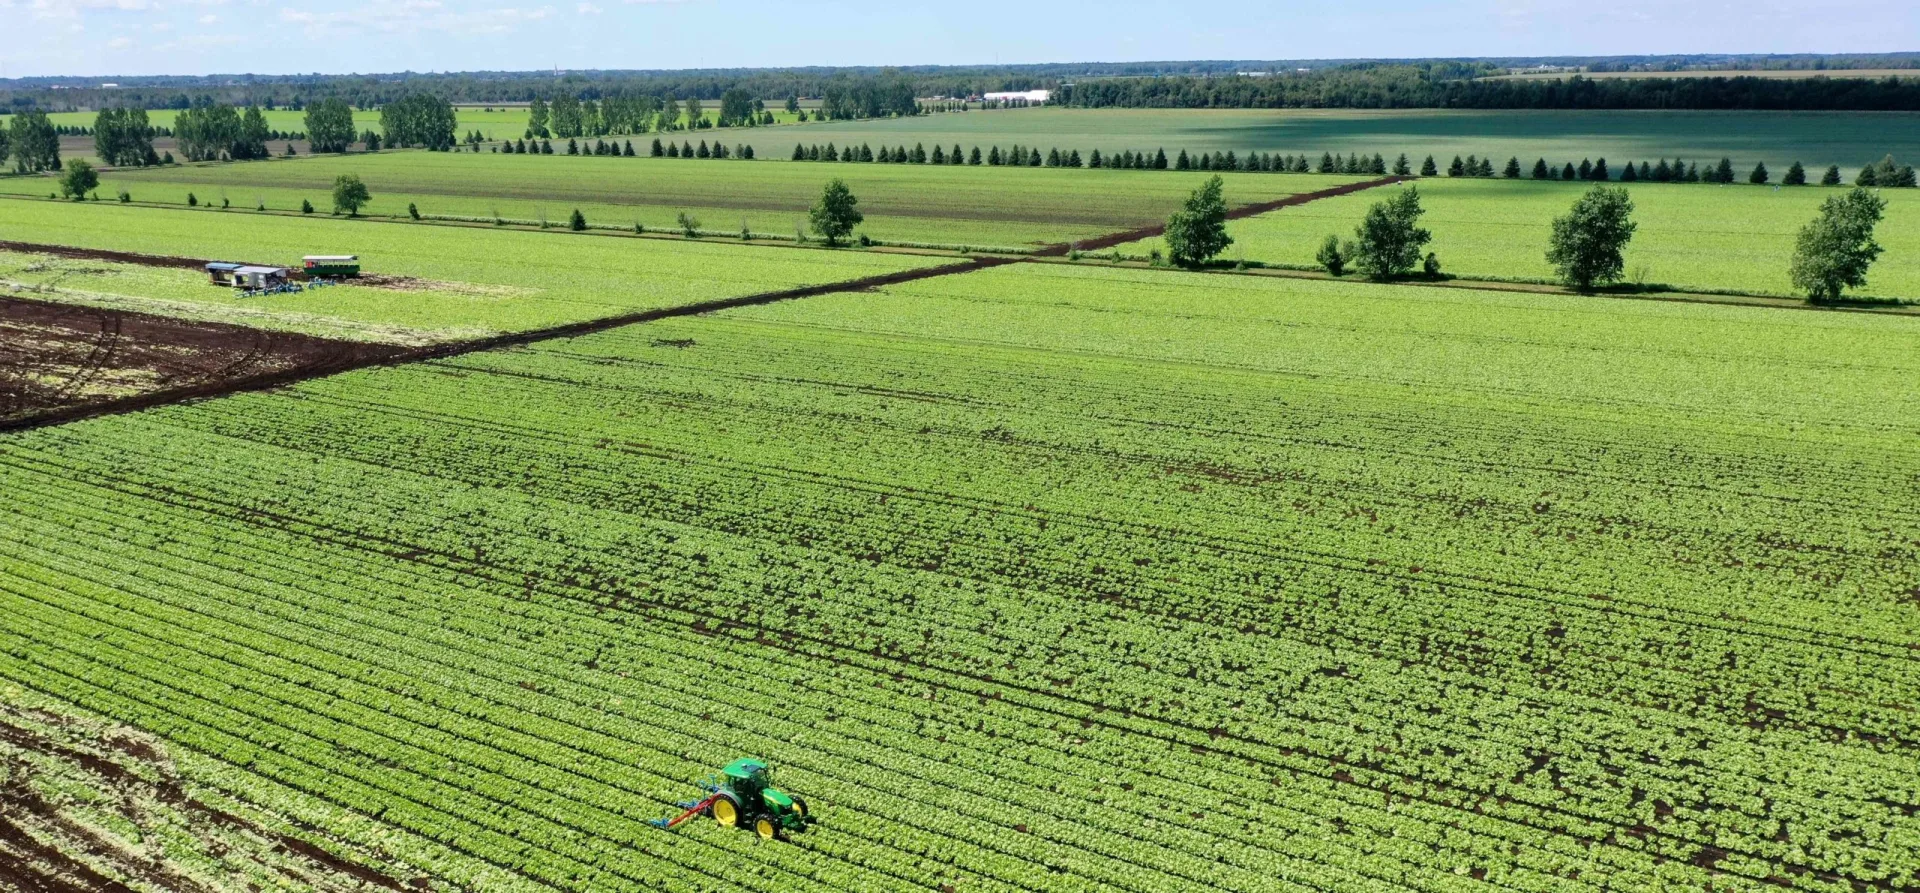
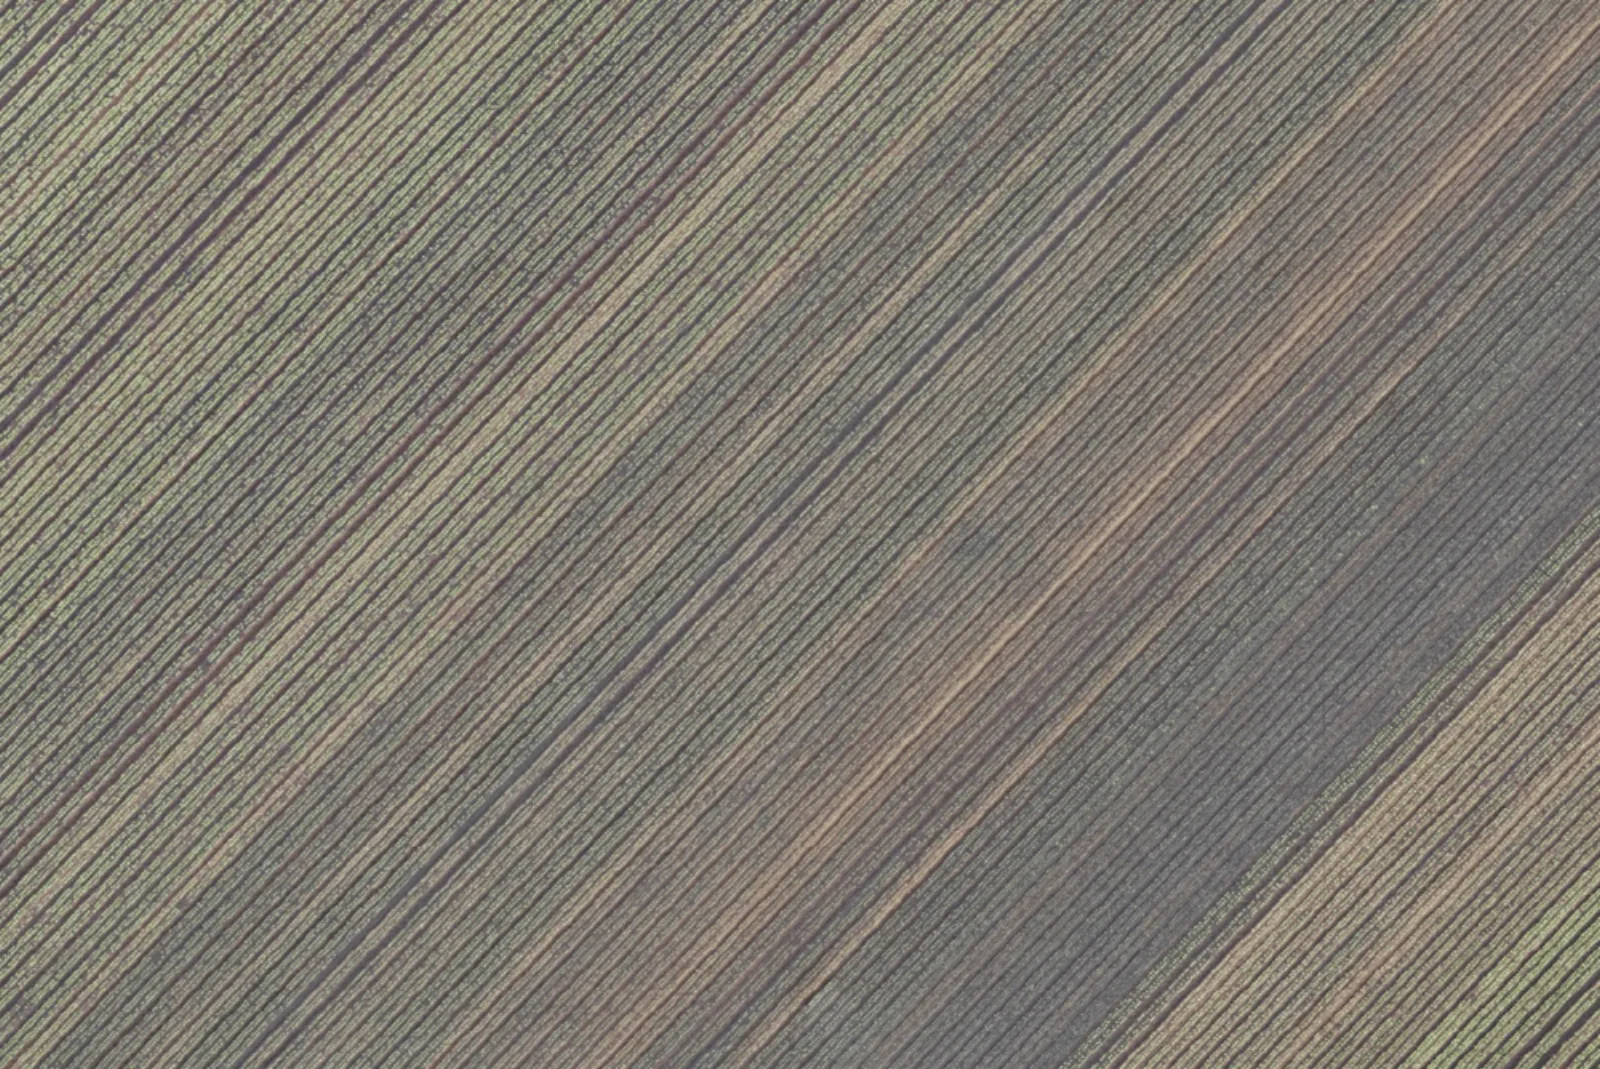
A single greenhouse-adjacent block flown, reconstructed into a centimetre-grade orthomosaic, and counted crop by crop directly from the mosaic. Every figure below was measured from the aerial dataset.
Start a flight
Tell us the crop and the acreage. We'll scope the flight, the indices and the deliverable, and hand you decisions you can act on this season.
Start a project →